Diagrid Dev Dashboard
The Diagrid Dev Dashboard is a companion for local Dapr development. It gives you a live view of everything Dapr running on your machine, plus guided builders for authoring Dapr component files and resiliency policies.
The dashboard is a single binary that runs on your host.
It discovers the apps you start with dapr run / dapr run -f, Docker Compose, TestContainers or Aspire and reads workflow data directly from your local Dapr state store.
Prerequisites
- Dapr installed and initialized with
dapr init. This creates the local Redis state store (withactorStateStore: "true") that Dapr workflows persist to, which is what the dashboard reads. - One or more Dapr apps running locally, for example a Dapr Workflow quickstart or any app using the Workflow API.
Install the dashboard
Choose the installation method that fits your setup.
- macOS / Linux
- Windows
Installs to ~/.local/bin:
curl -sSL https://raw.githubusercontent.com/diagridio/dev-dashboard/main/scripts/install.sh | sh
Installs to %LOCALAPPDATA%\Programs\dev-dashboard:
iwr -useb https://raw.githubusercontent.com/diagridio/dev-dashboard/main/scripts/install.ps1 | iex
If the install directory is not on your PATH, the script prints the line to add.
Verify the installation:
dev-dashboard --version
Run the dashboard
Start the dashboard:
dev-dashboard
This opens the dashboard at http://localhost:9090 in your browser automatically.
To start on a custom port, use the --port flag:
dev-dashboard --port 8080
No further configuration is needed: any app started with dapr run / dapr run -f, Docker Compose, TestContainers, or Aspire, shows up within one refresh cycle.
Using the dashboard
Start your Dapr application as you normally would, then trigger at least one workflow instance. The dashboard only shows state that already exists, so an idle store shows an empty list.
Applications overview
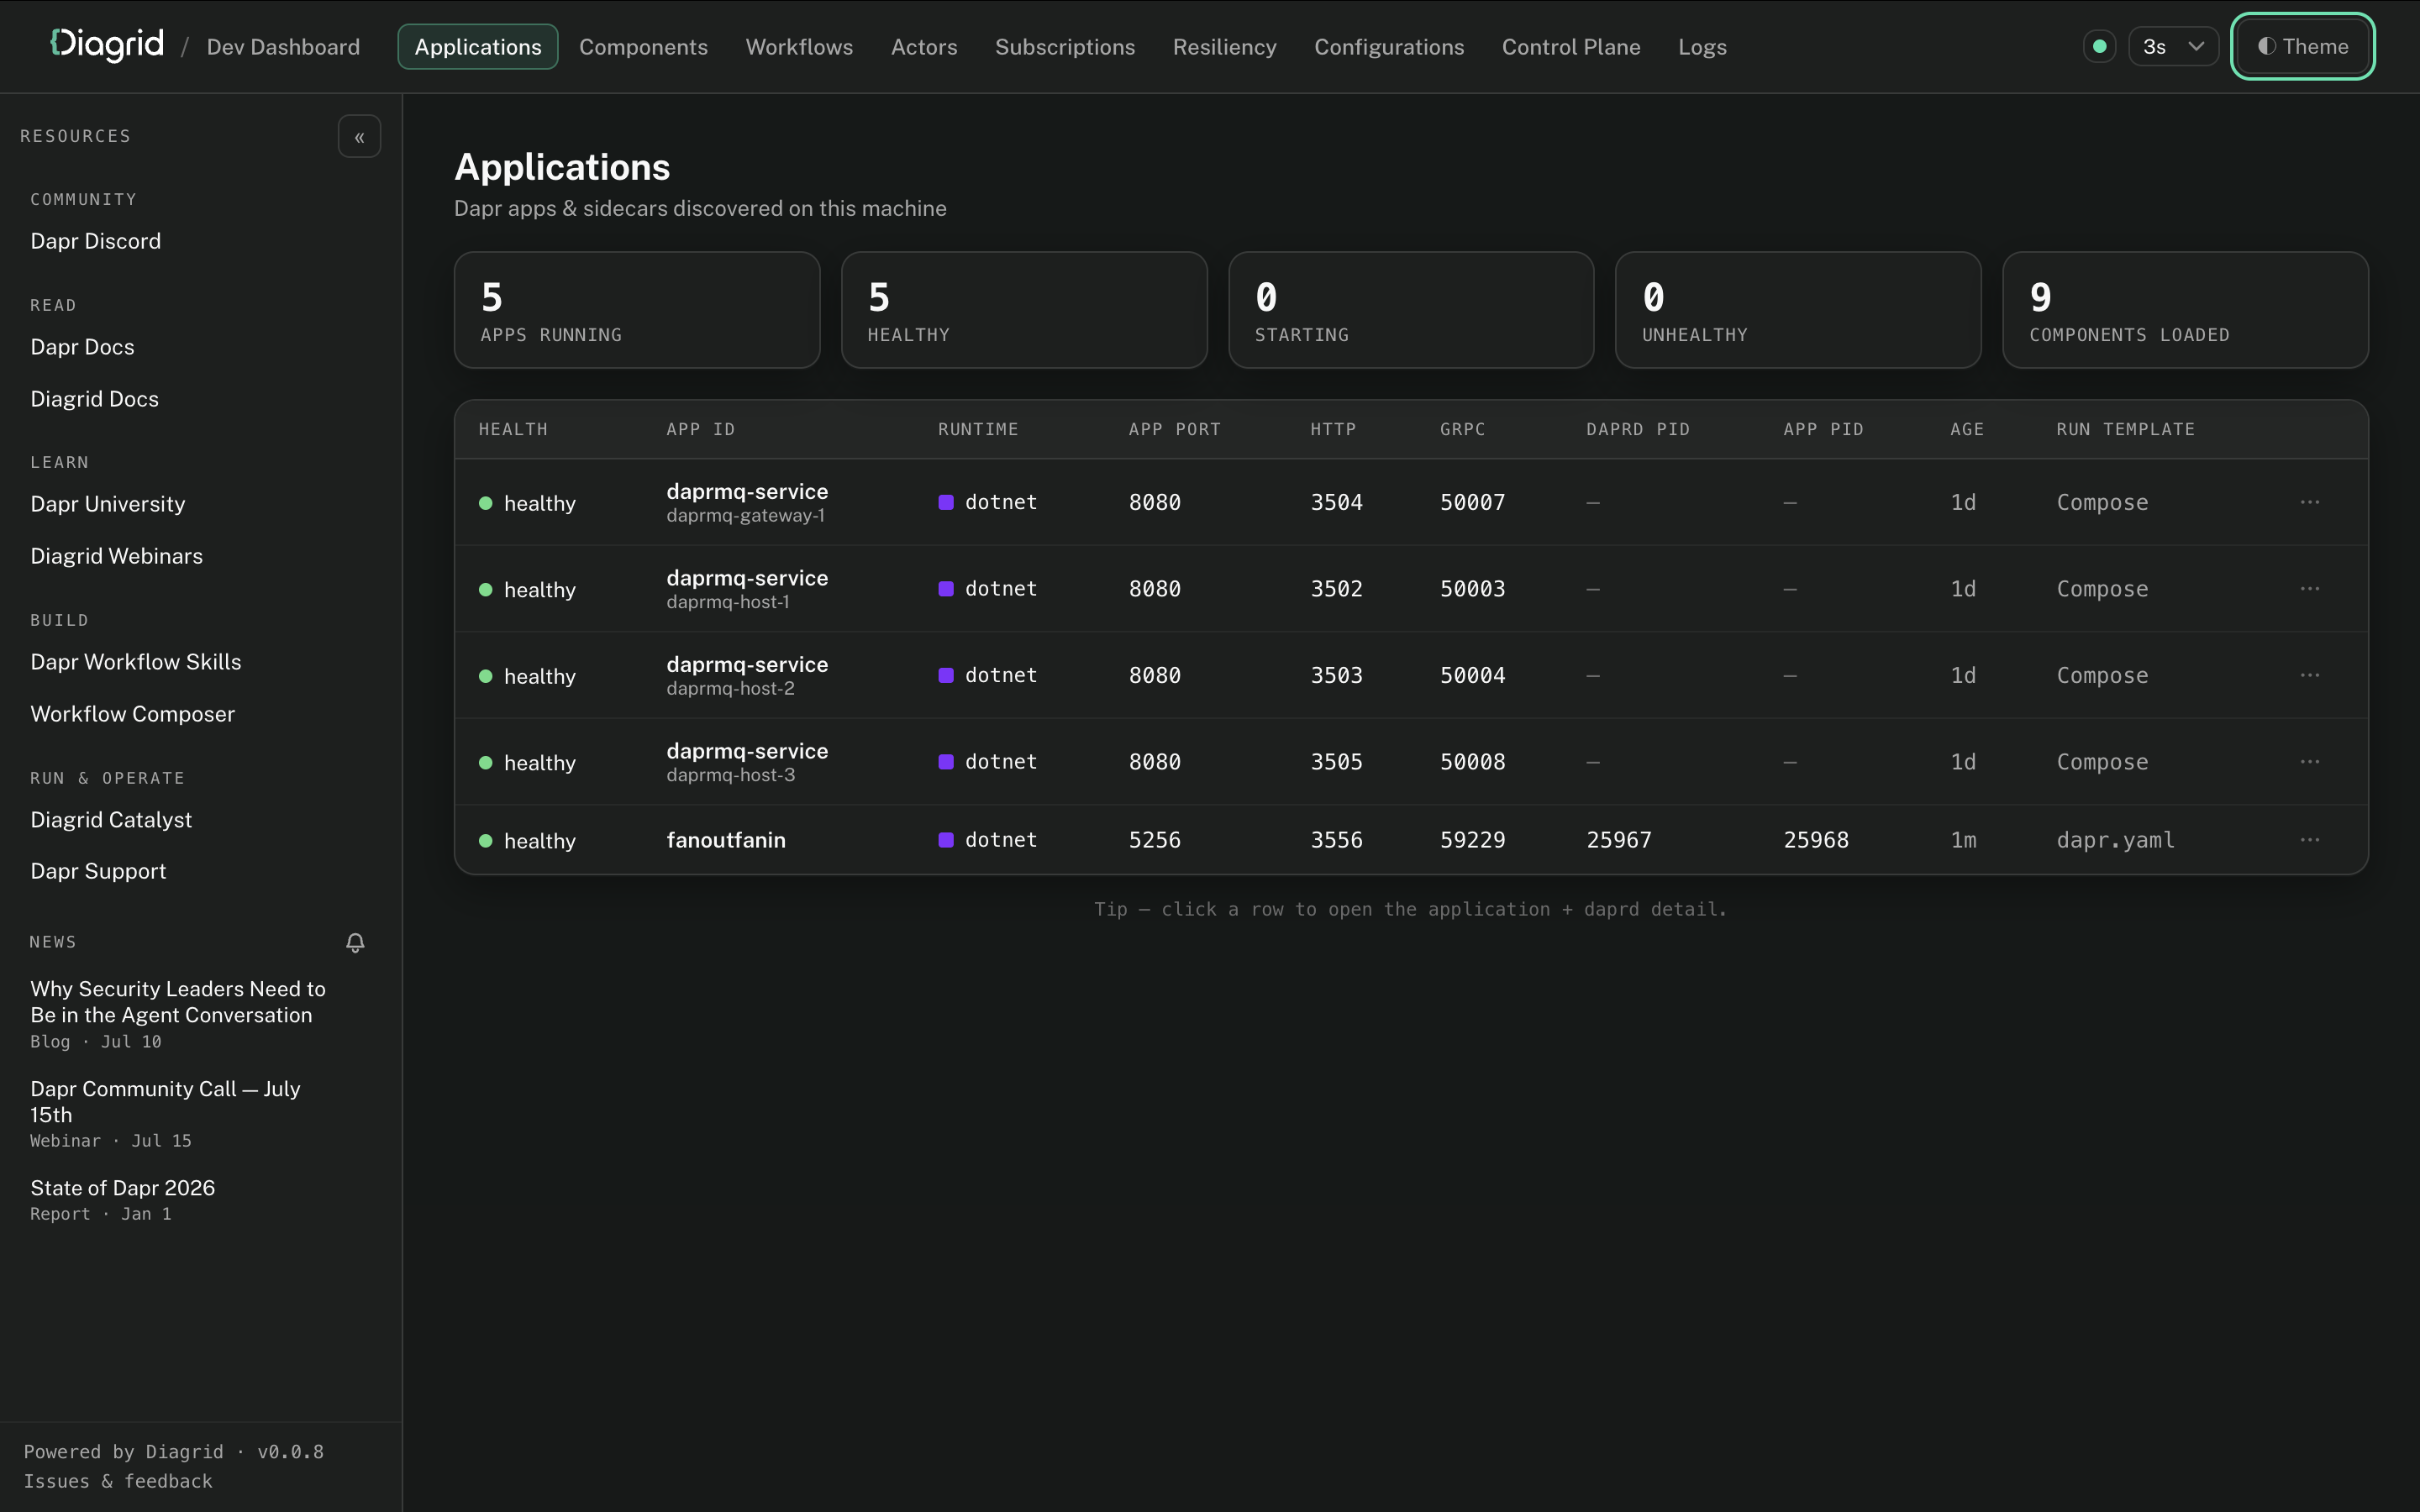
The Apps page shows a live table of every Dapr app running on your machine: app ID, health, runtime and language, app / HTTP / gRPC ports, PIDs, and age.
Application detail
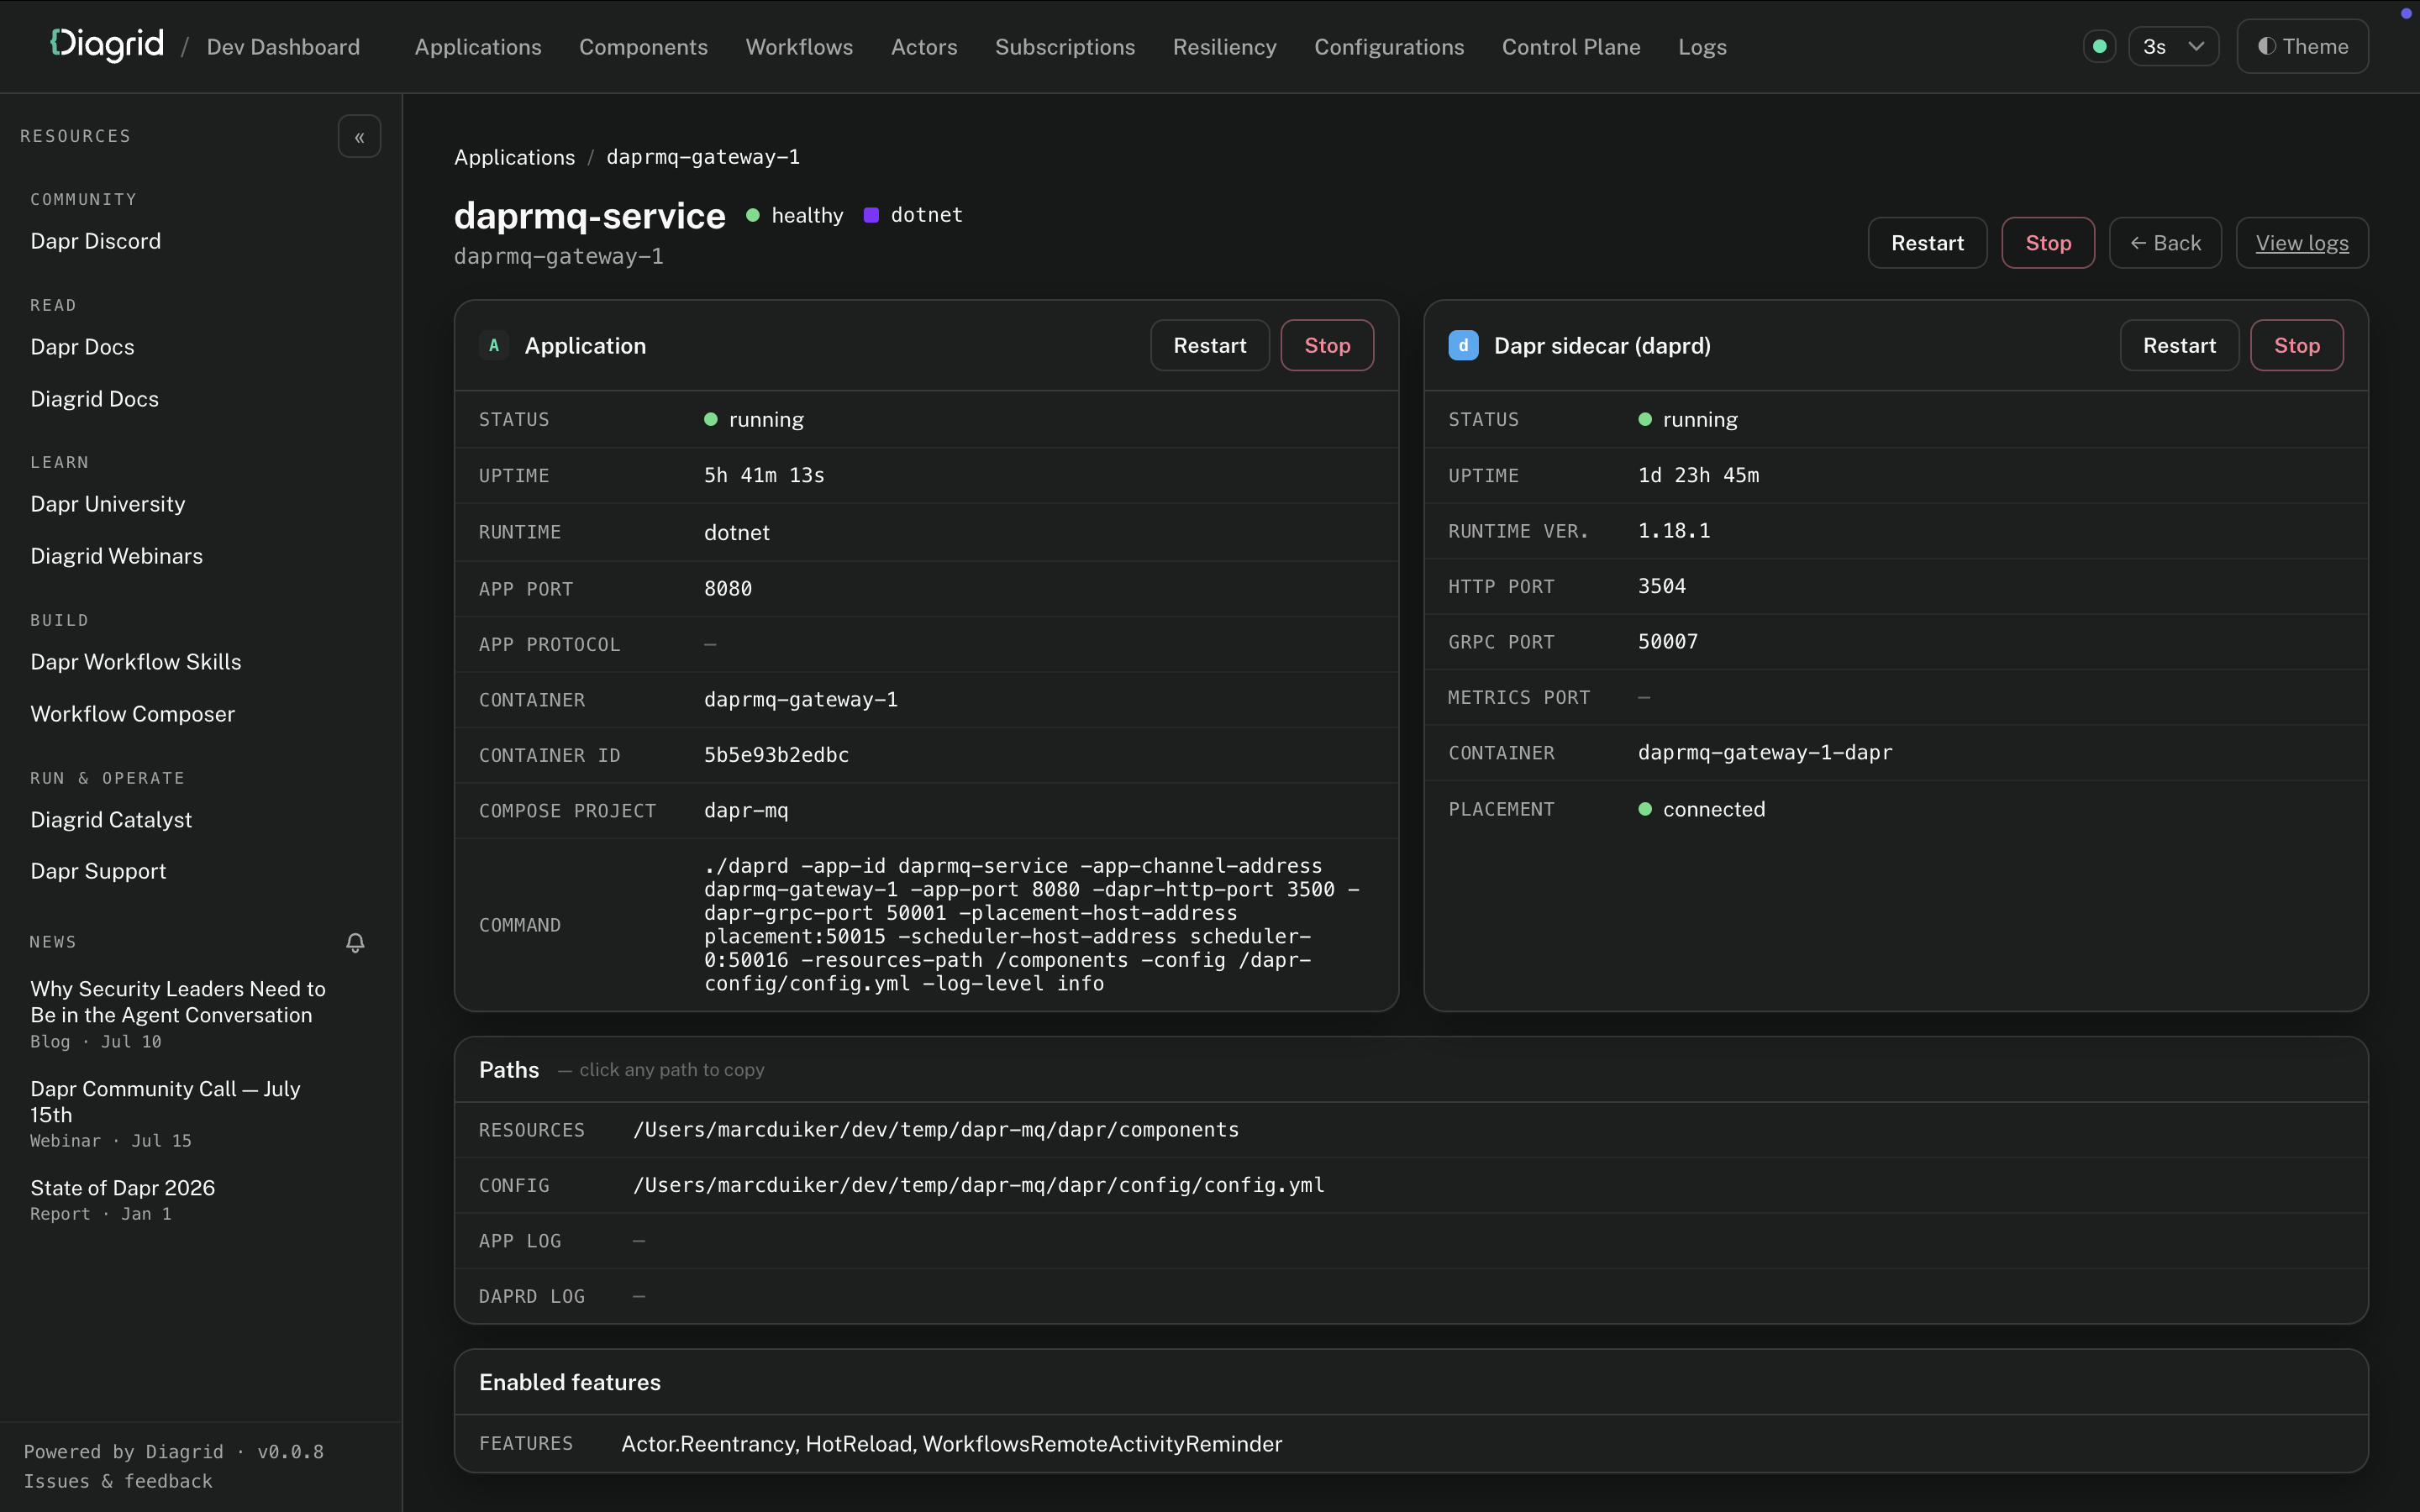
Click an app to drill into its detail page for its ports, PIDs, launch command, resource and configuration paths, runtime metadata, enabled features, and the components it loaded. Active actor types and pub/sub subscriptions are also aggregated across apps, each linking back to the owning application.
Workflows
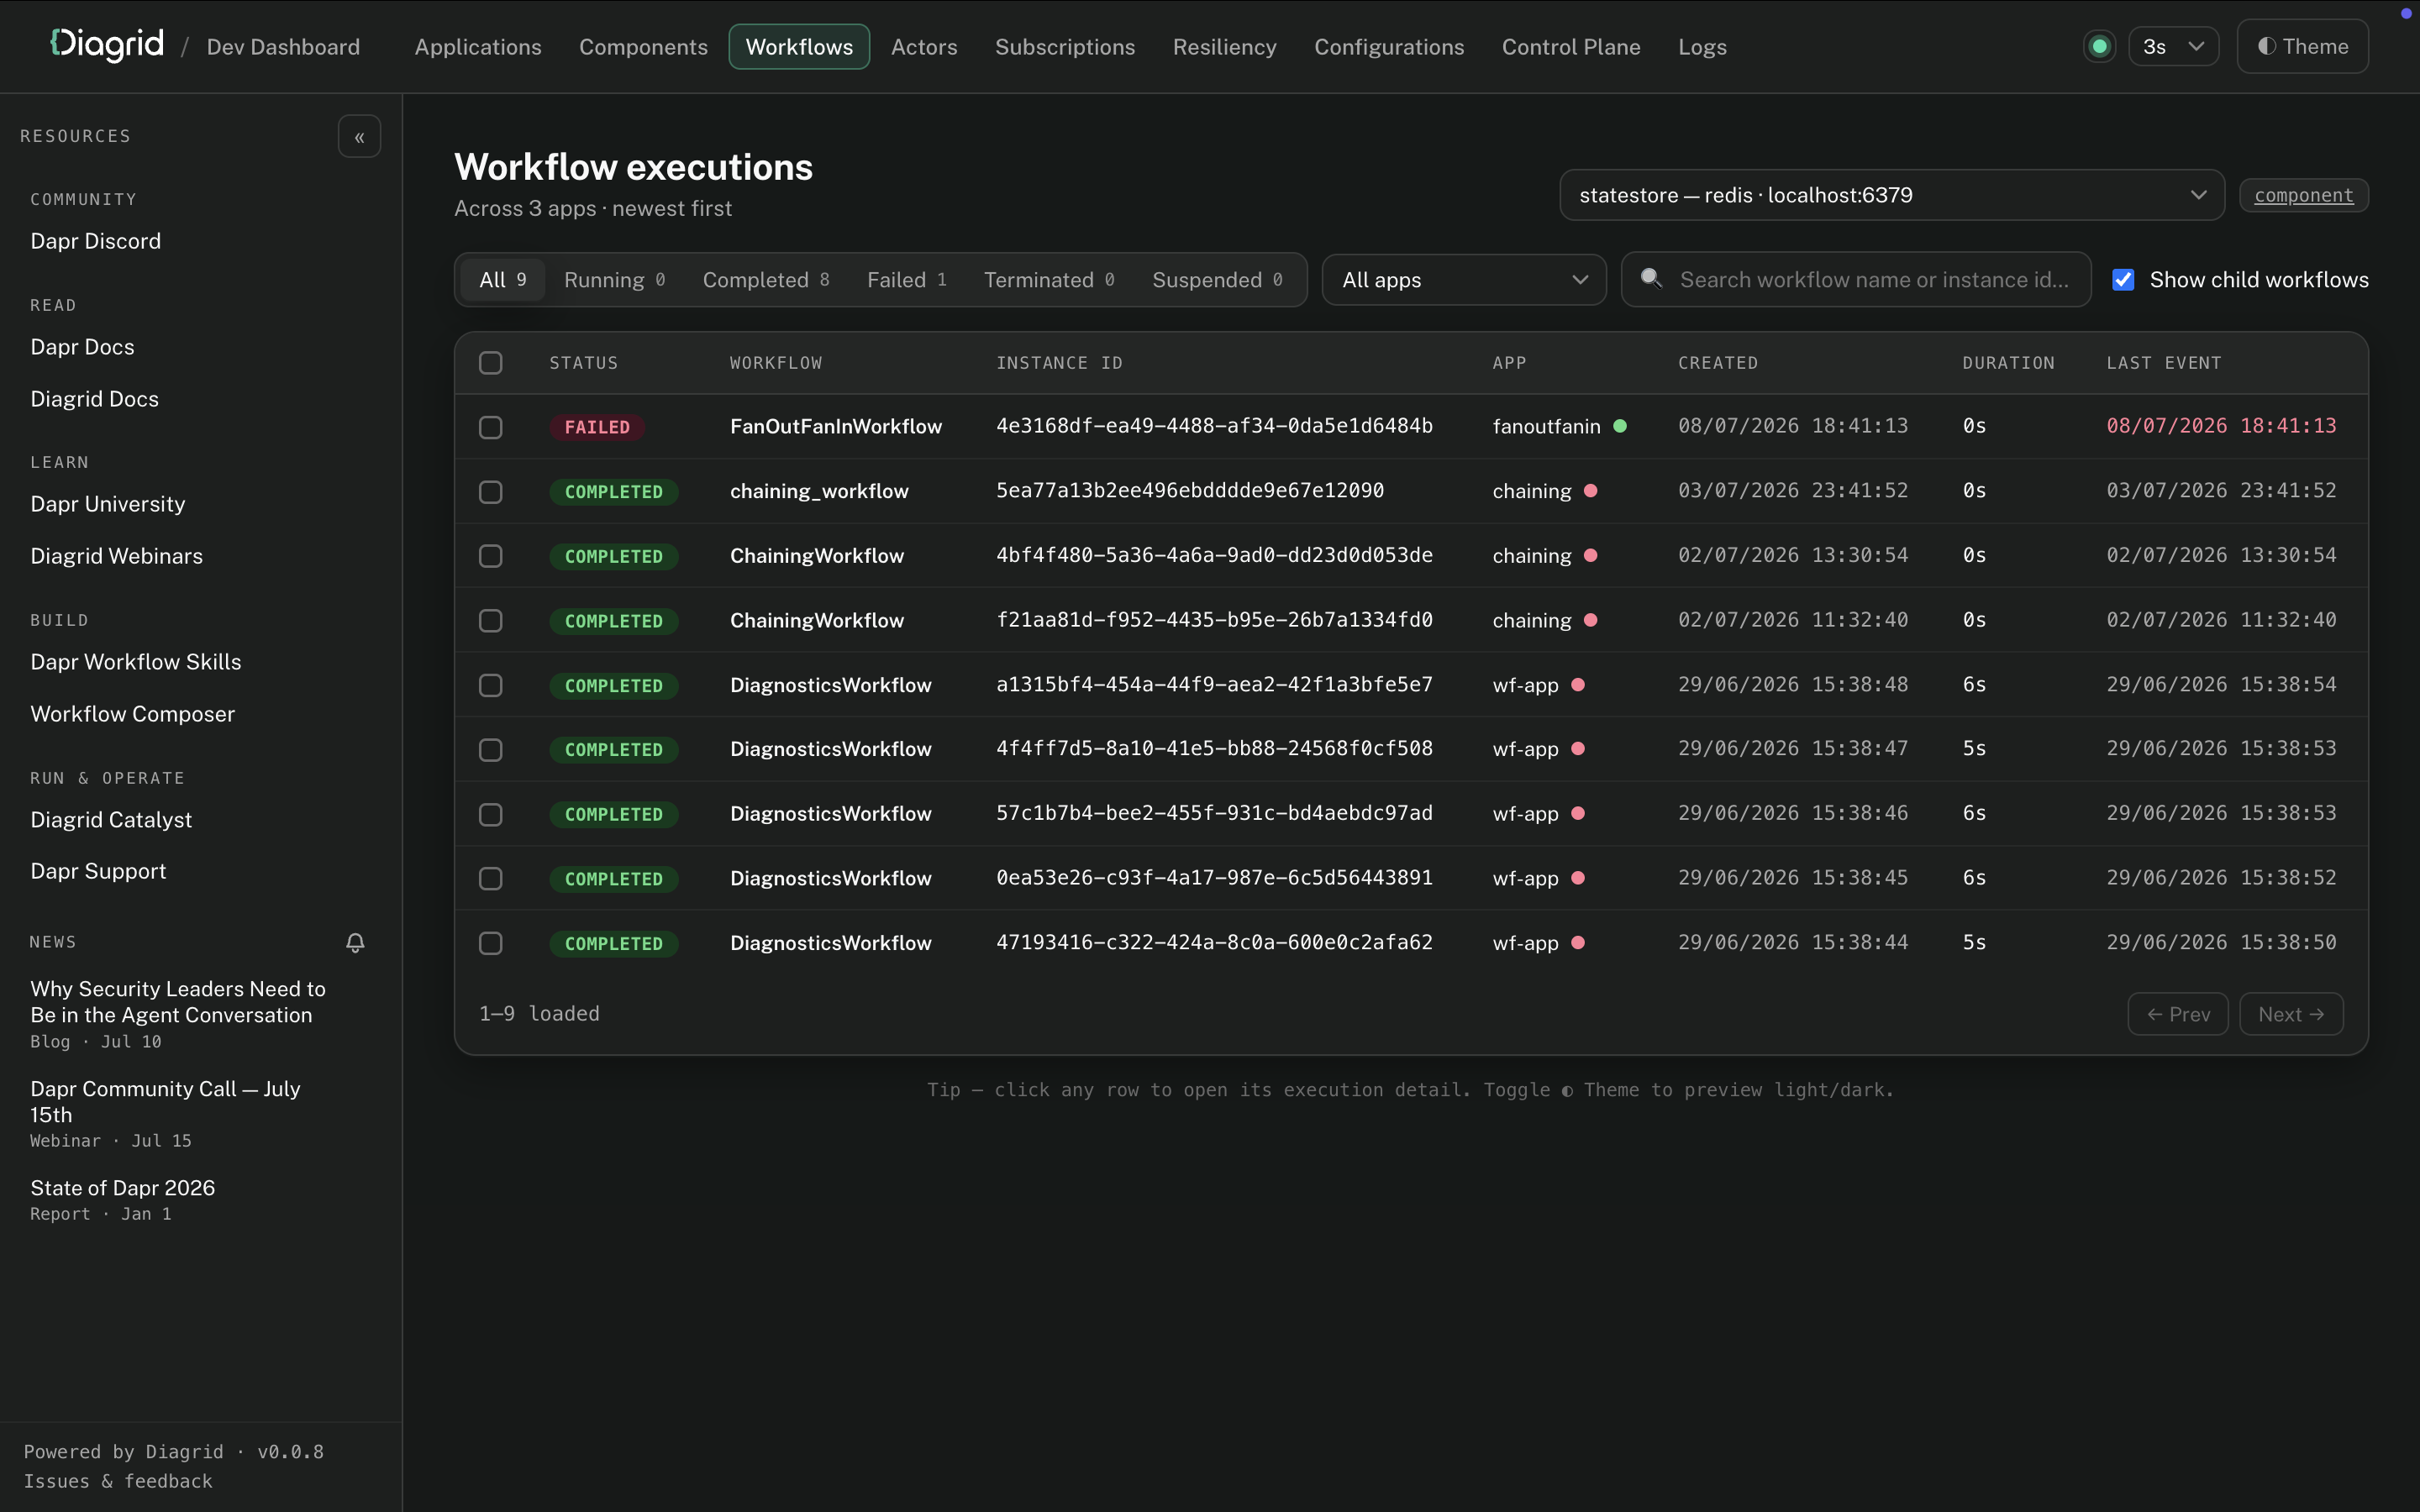
The Workflows page lists workflow executions across all apps, with status filters and search. Instances are read directly from your local Dapr state store.
Workflow detail
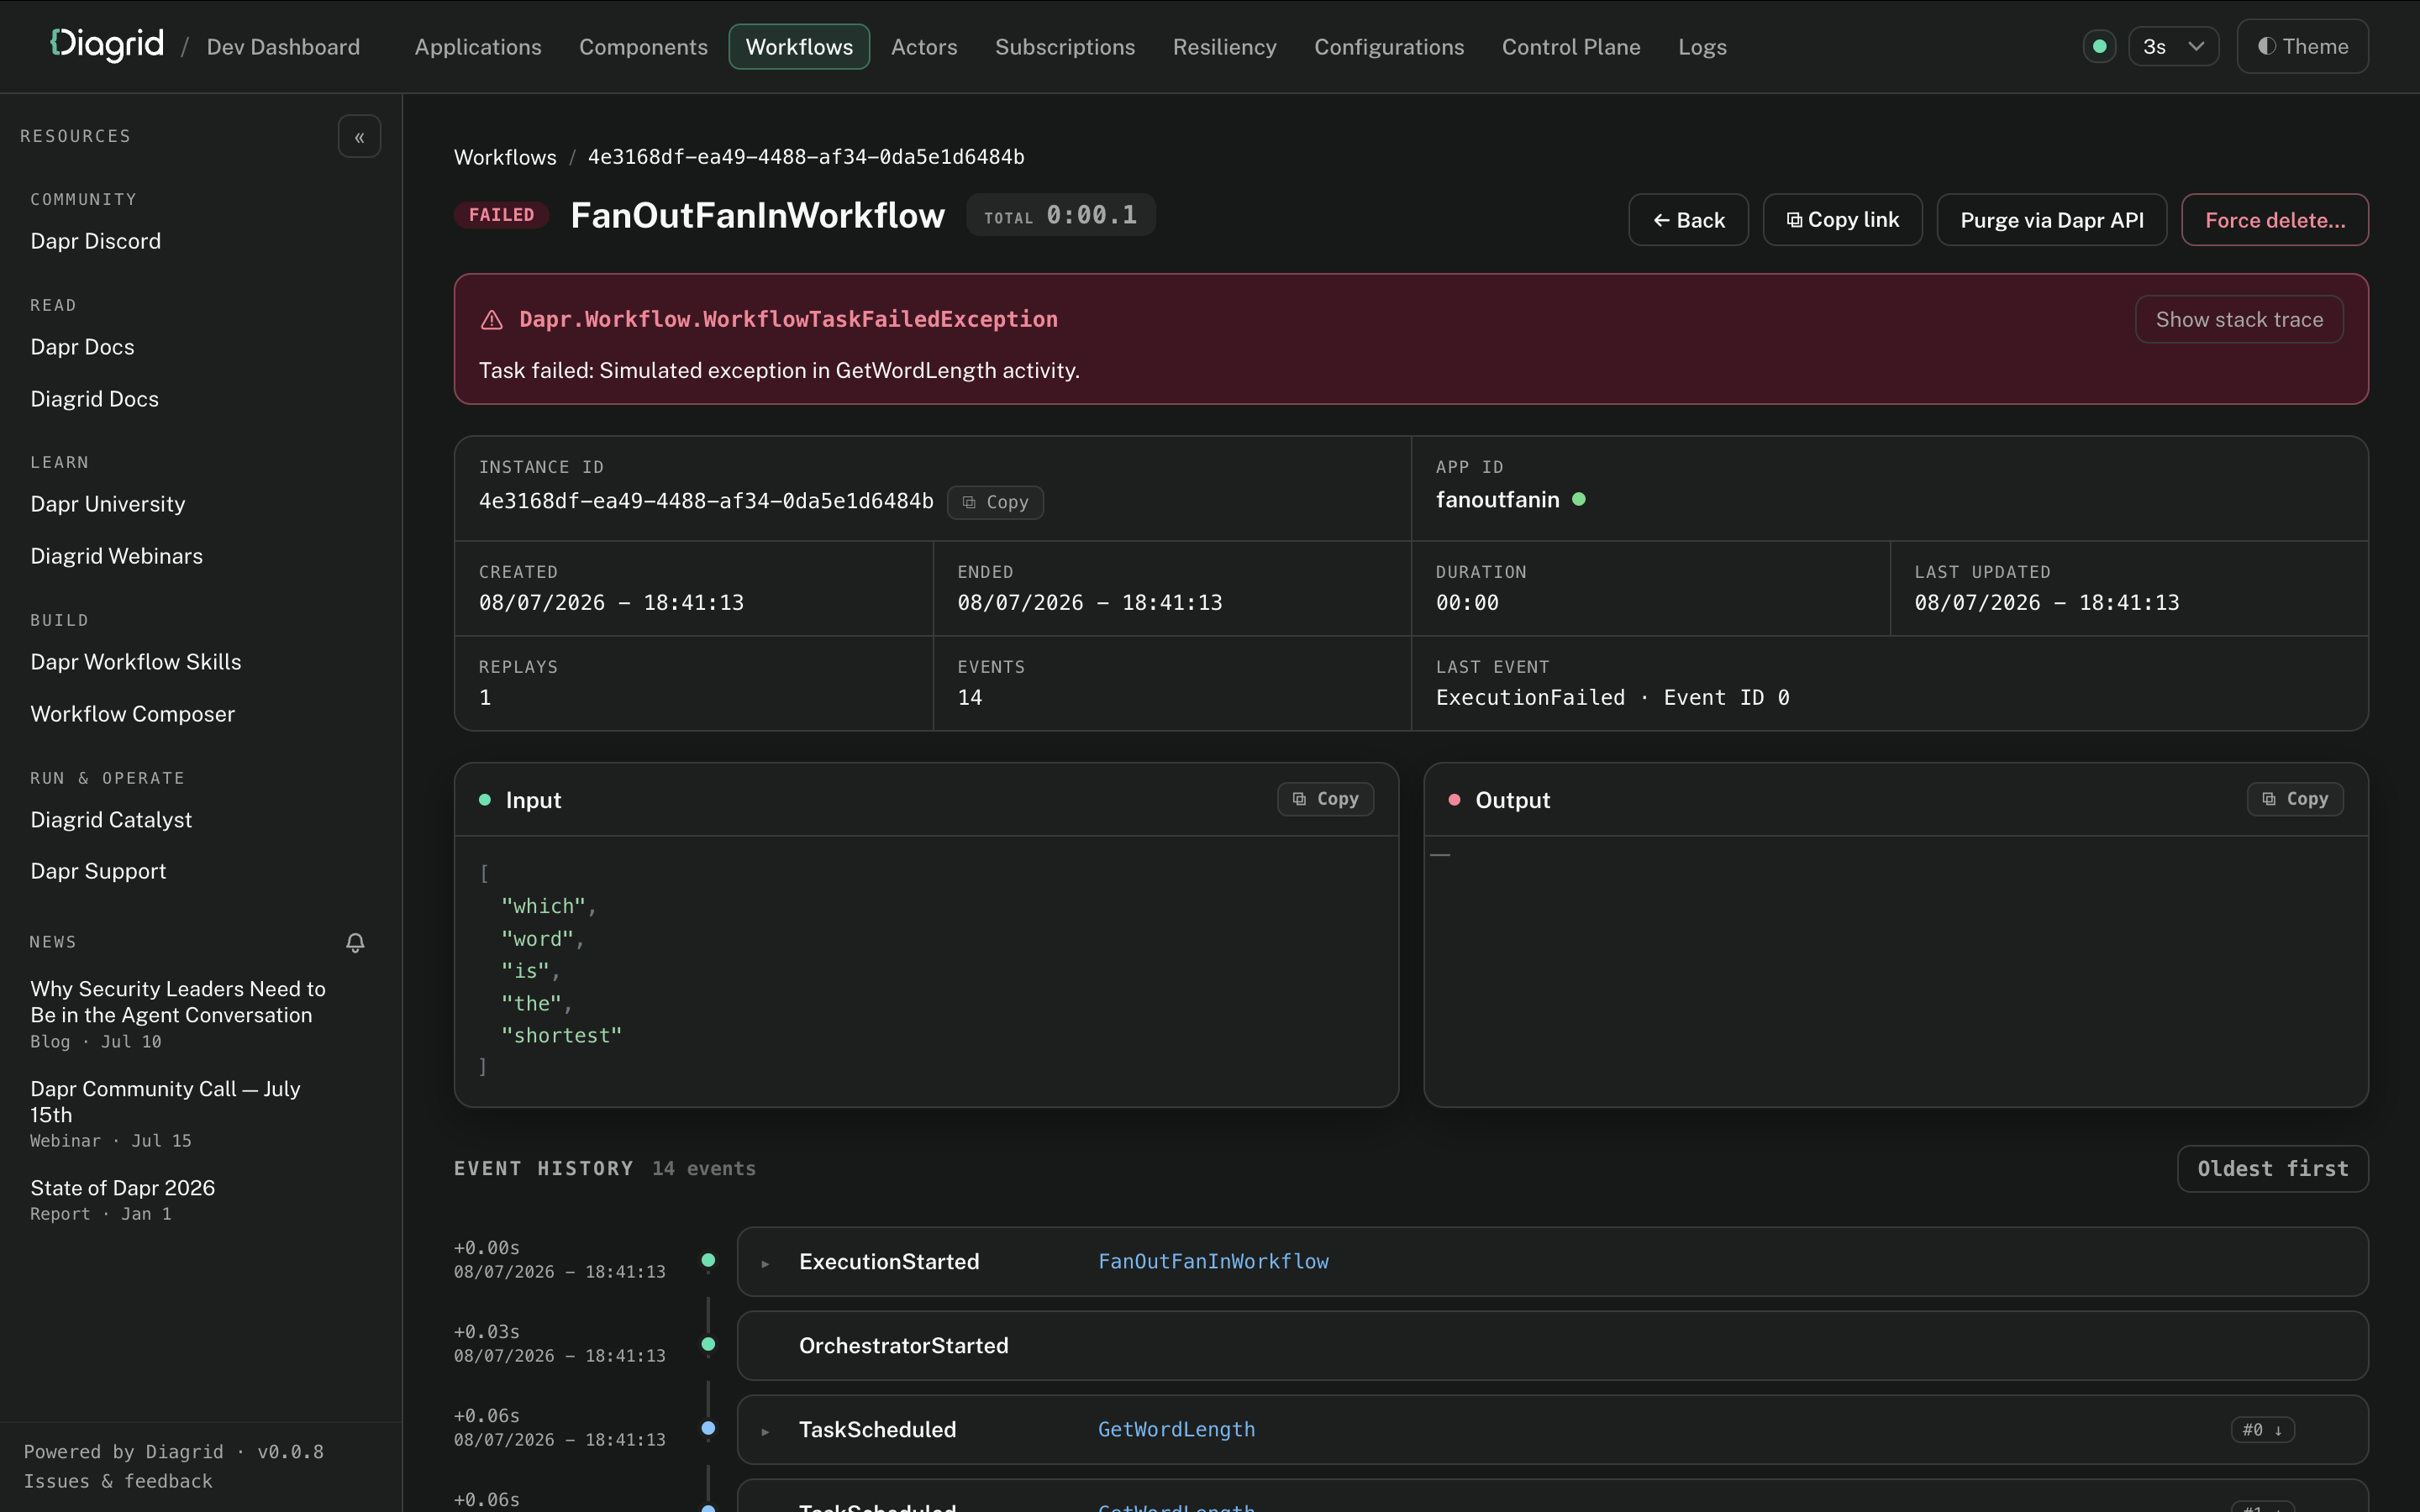
Open a workflow instance to watch its live event history, input, output, custom status, and a continuously ticking wall-clock while it runs. You can terminate or purge instances individually or in bulk, with an explicit force-delete fallback for stuck or orphaned state.
Components and configurations
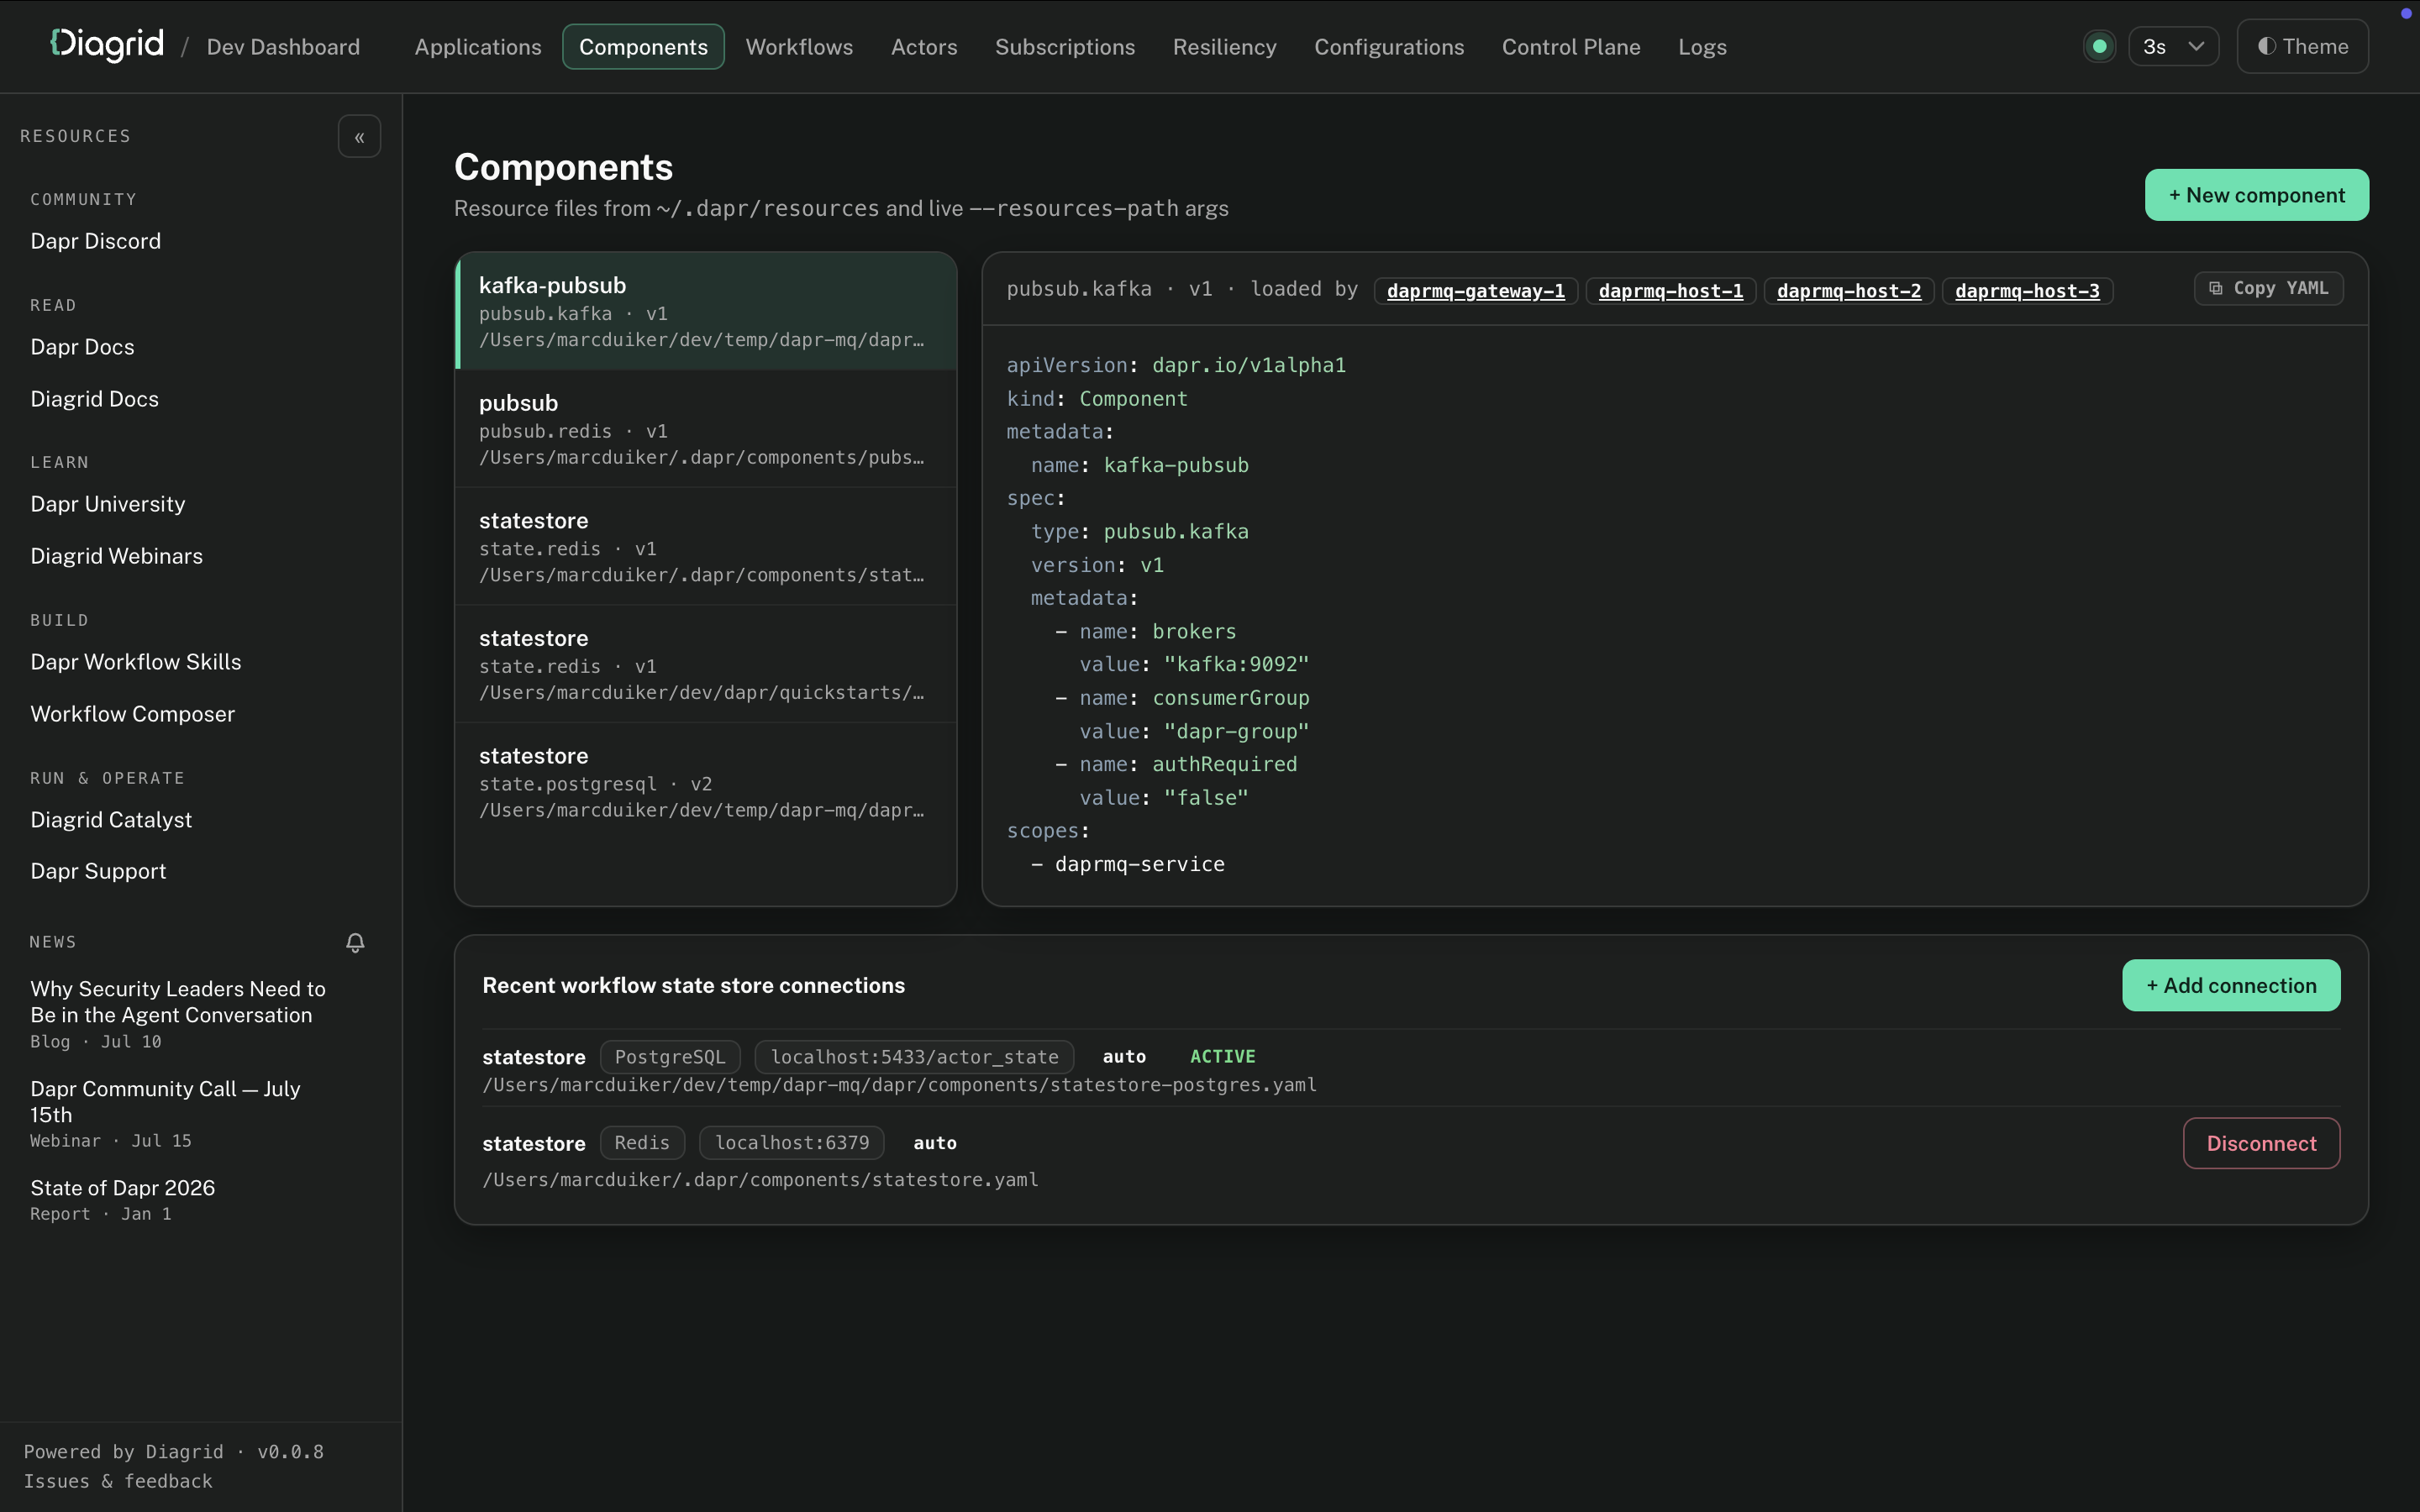
The Components page provides read-only YAML viewers for the Dapr components and configurations loaded from ~/.dapr and your apps' resource paths, enriched with which apps loaded each one. A connections panel lets you add, edit, and disconnect the workflow state stores the dashboard reads from.
Log streaming
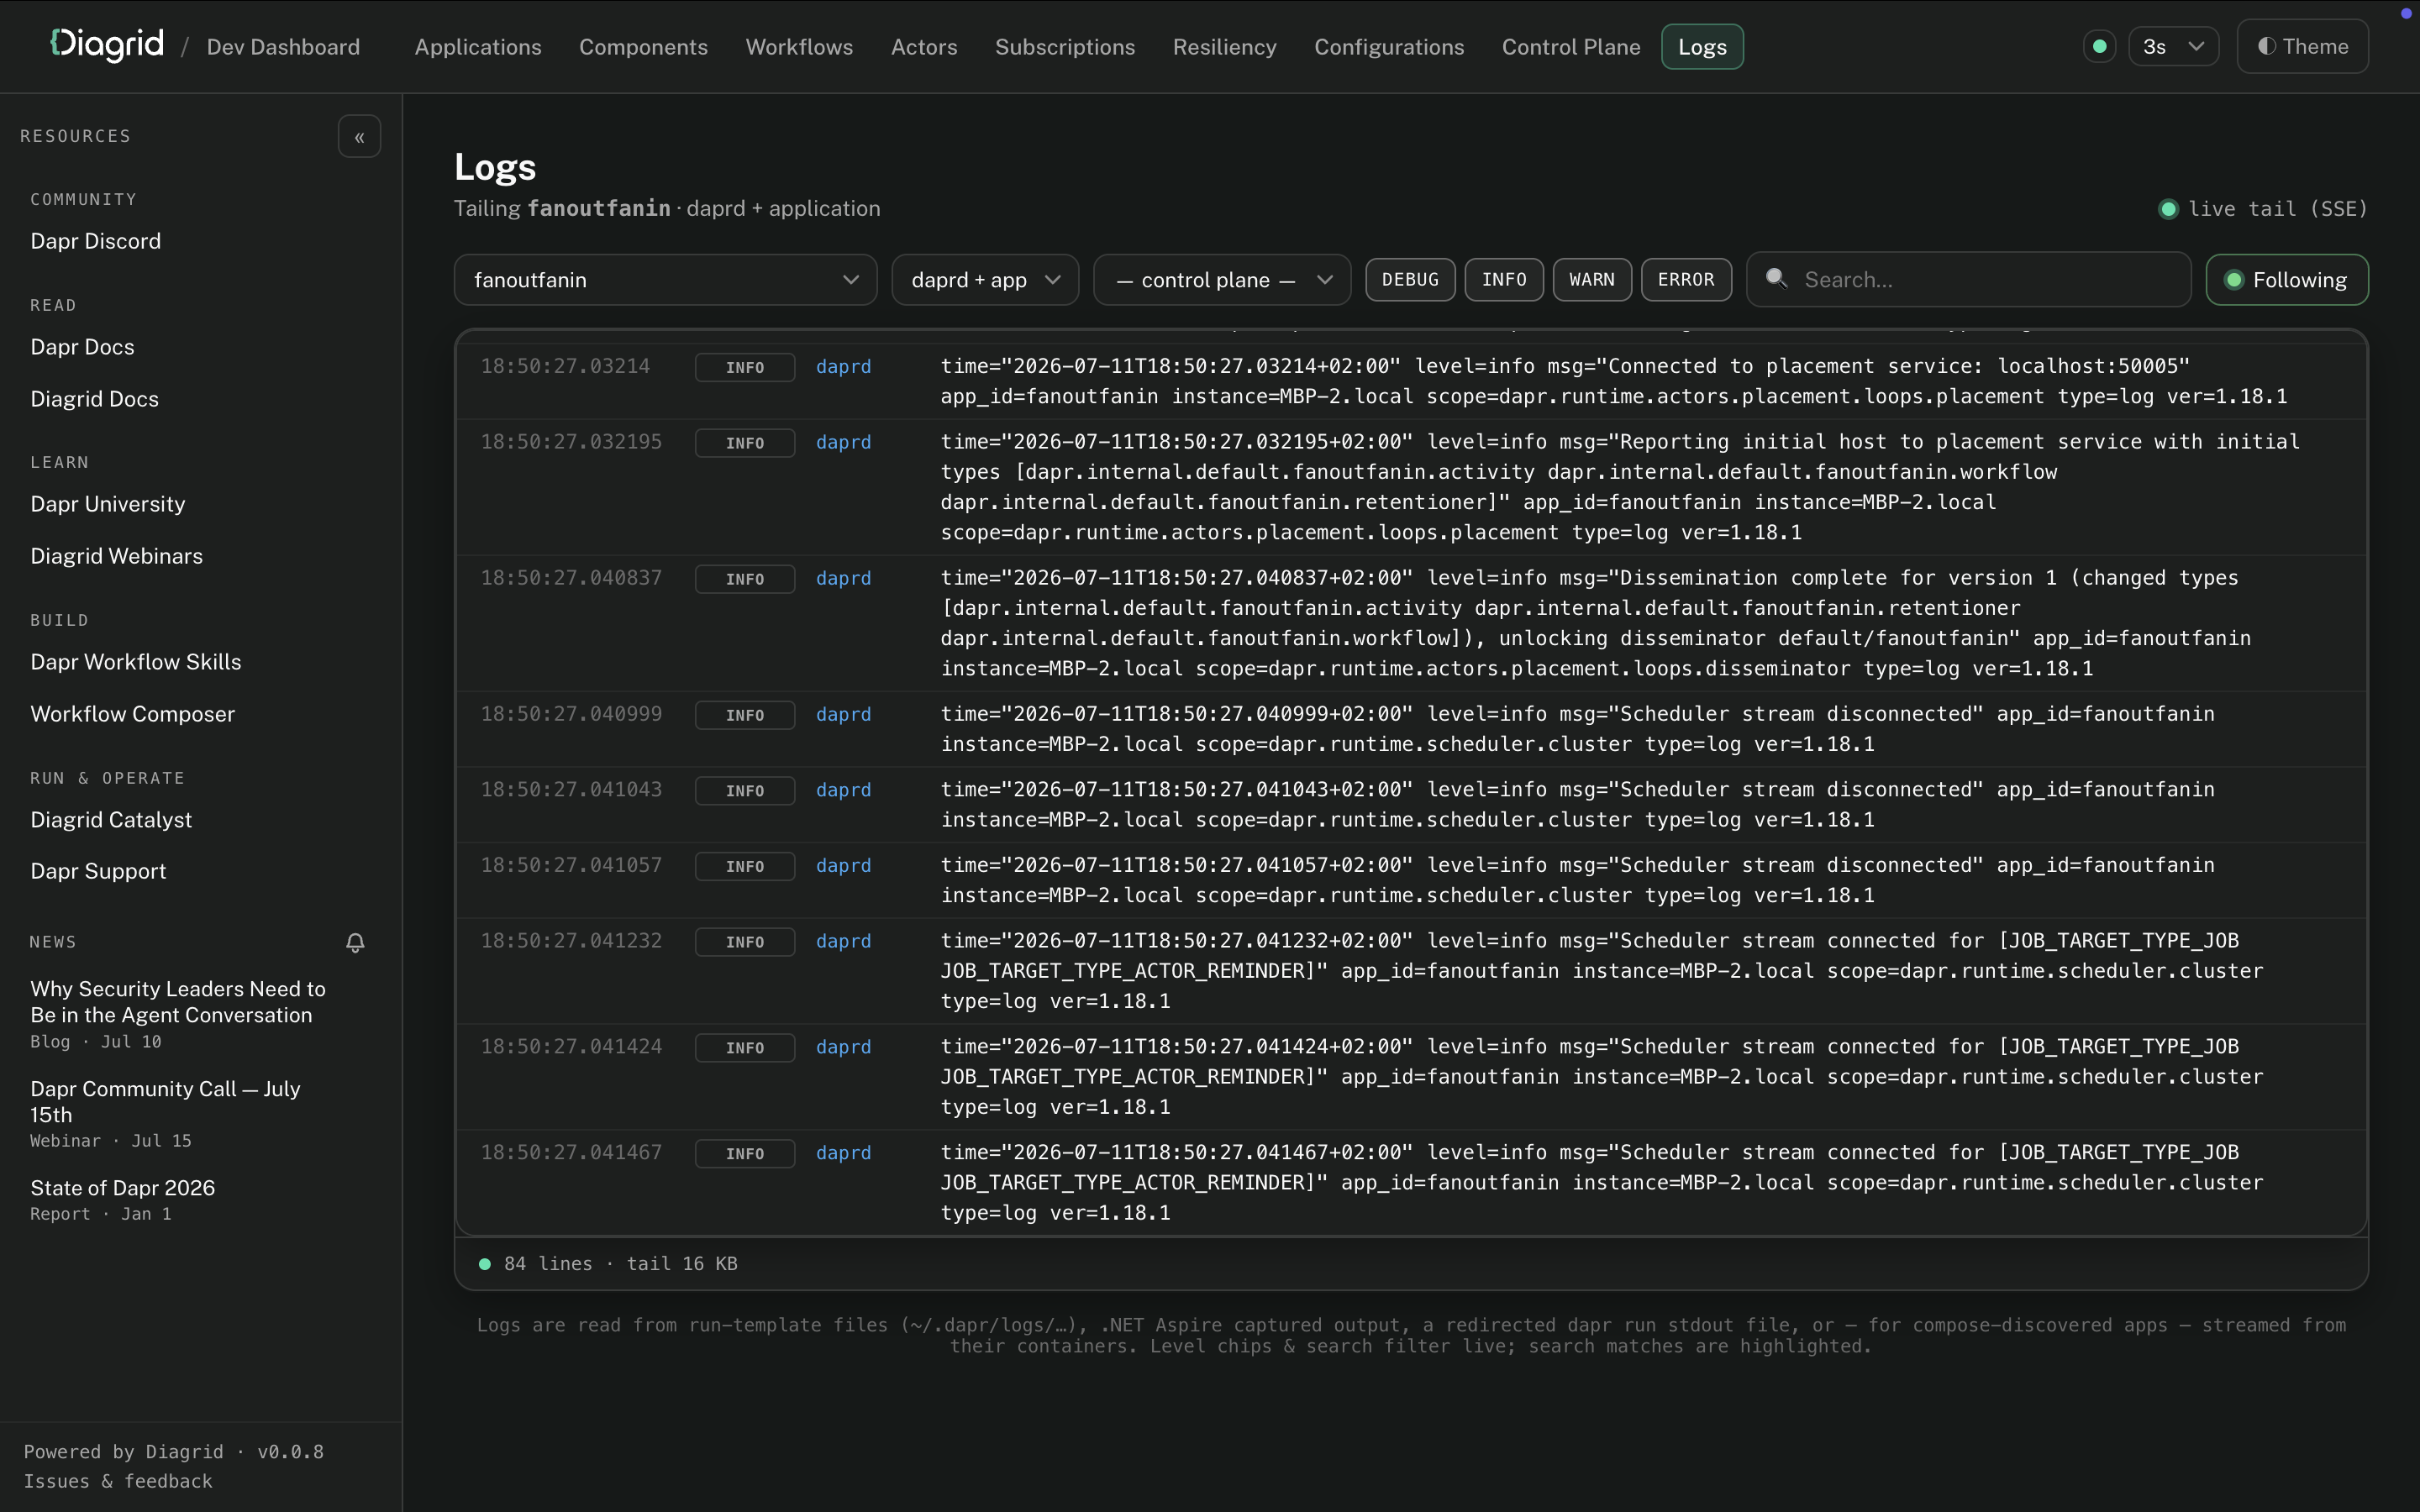
The dashboard tails each app's Dapr sidecar and application logs live, with level coloring, keyword highlighting, and a follow toggle.
Resiliency Builder
The Resiliency Builder helps you create Dapr resiliency policies, such as retries, timeouts, and circuit breakers, directly from the dashboard. Use the Resiliency Builder wizard to configure the policies, hand-edit the result if needed, and copy the generated YAML or download the file to disk.
Component Builder
The Component Builder lets you configure Dapr components visually, without hand-editing YAML. Use the Component Builder wizard to pick a type from the full Dapr catalog, fill in its metadata fields, choose an authentication profile, then copy the generated YAML or download the file to disk.
Update the dashboard
On startup the dashboard checks GitHub for a newer release and shows an Update available indicator in the UI when one exists.
Update to the latest release:
dev-dashboard update
To install a specific version (which can also downgrade or reinstall):
dev-dashboard update 1.2.0
The update command downloads the release archive for your platform, verifies its checksum, and atomically replaces the running binary. Restart any running dashboard to use the new version.
Limitations
- The dashboard reads workflows from the following local state stores only:
- Redis
- PostgreSQL
- SQLite
- This dashboard is intended for local development only. It is not designed for Kubernetes, production, or any shared or hosted environment. If you need workflow insights for other environments, use Catalyst.
Troubleshooting
-
If the dashboard doesn't behave as expected, run it with
--verboseto print diagnostic logs to stderr:dev-dashboard --verbose -
If the Workflows page is empty, confirm your app has actually persisted a workflow instance (an idle store shows an empty list). The dashboard auto-detects state stores from
~/.dapr/componentsand the resource paths of running apps. If detection is ambiguous, pick a store with the selector on the Workflows page, or point to one explicitly:dev-dashboard --statestore ~/.dapr/components/statestore.yaml -
Workflow keys are namespaced. The dashboard defaults to the
defaultnamespace; for another namespace, pass--namespace <ns>.
Feedback
We love to hear about your experience using the Diagrid Dev Dashboard! Please join our Diagrid Discord server and share your feedback.