API Logs
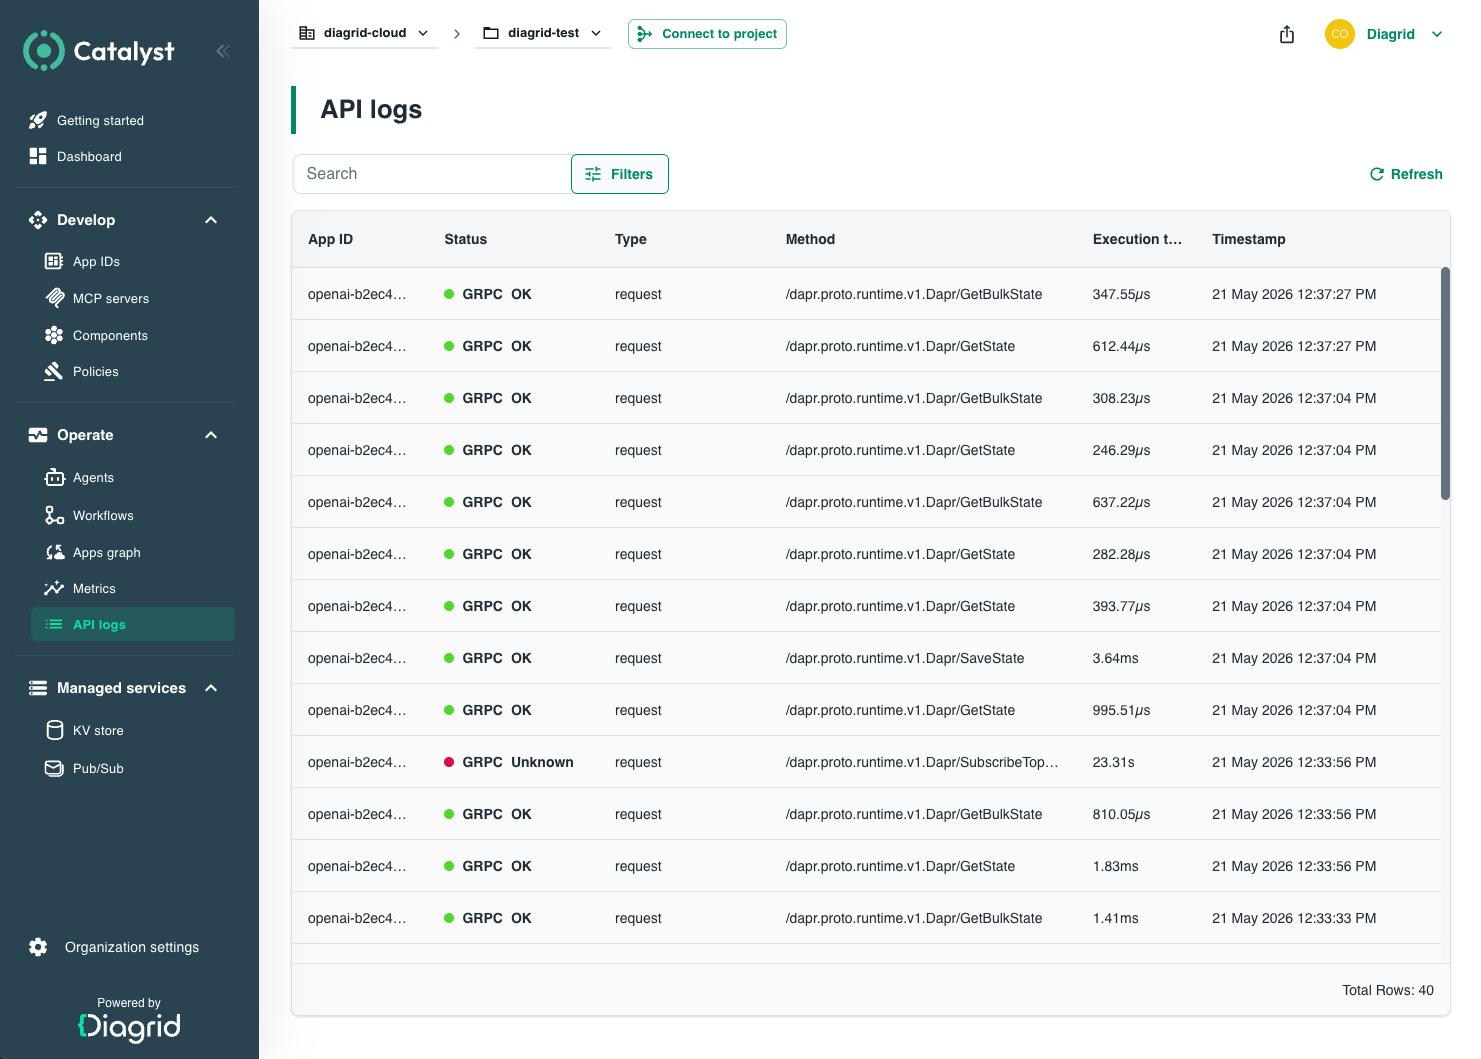
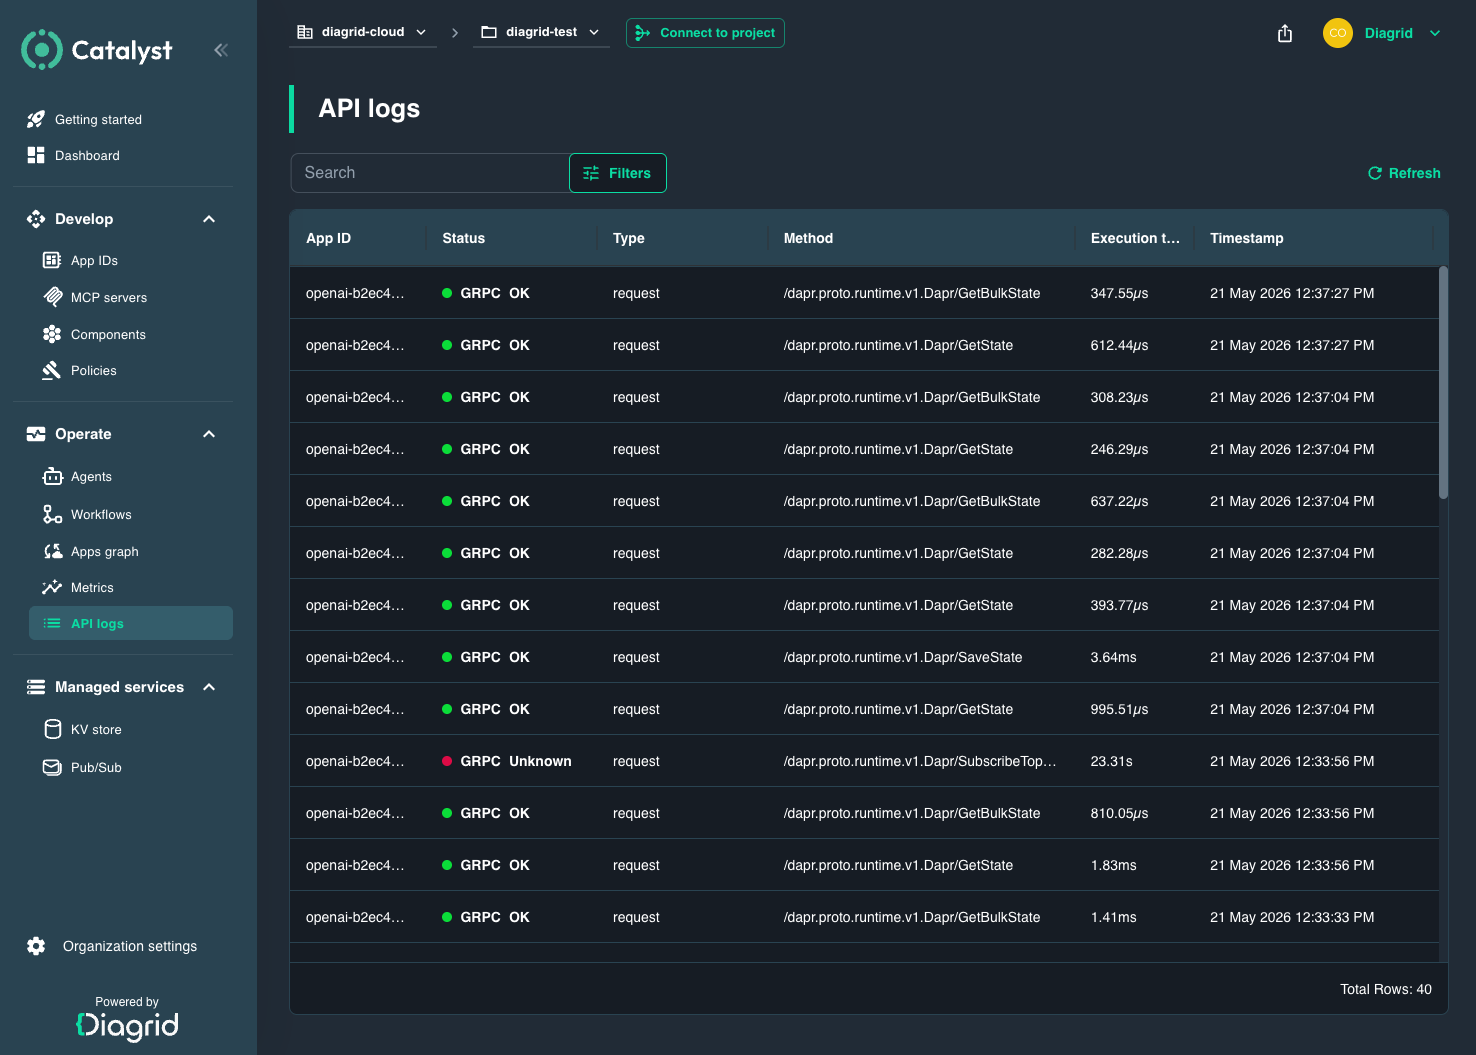
The API Logs page in the Catalyst console is a per-call record of every API call made by or to an App ID in a project. It surfaces exact request-level detail like method, status, latency, and more. For the concept-level explanation of Catalyst's observability model, see Observability.
What each entry captures
Each row in the table shows:
| Field | What it shows |
|---|---|
| App ID | The workload that made or received the call. |
| Status | HTTP status code or gRPC code, with a protocol badge and a success/failure indicator. |
| Type | The Dapr building block invoked — one of bindings, service-invocation, publish, state, workflows, or conversation. |
| Method | HTTP method and path (for example POST /v1.0/state/my-store) or the gRPC method name. |
| Execution time | Latency of the call, in milliseconds, microseconds, or nanoseconds. |
| Timestamp | UTC time the call was recorded. |
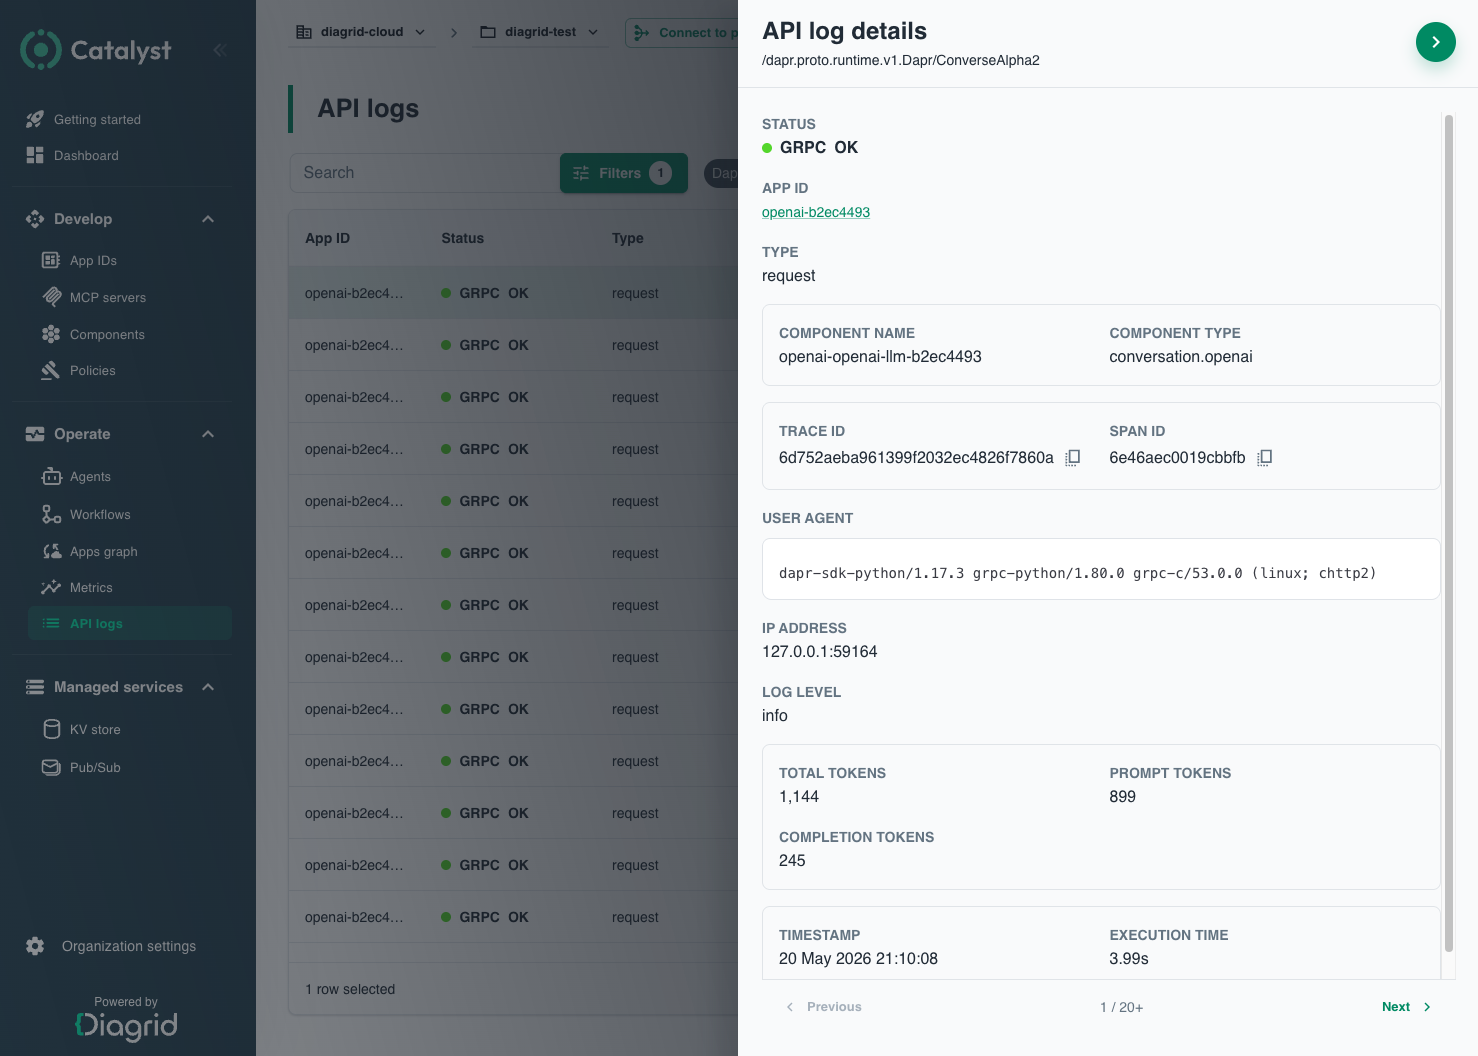
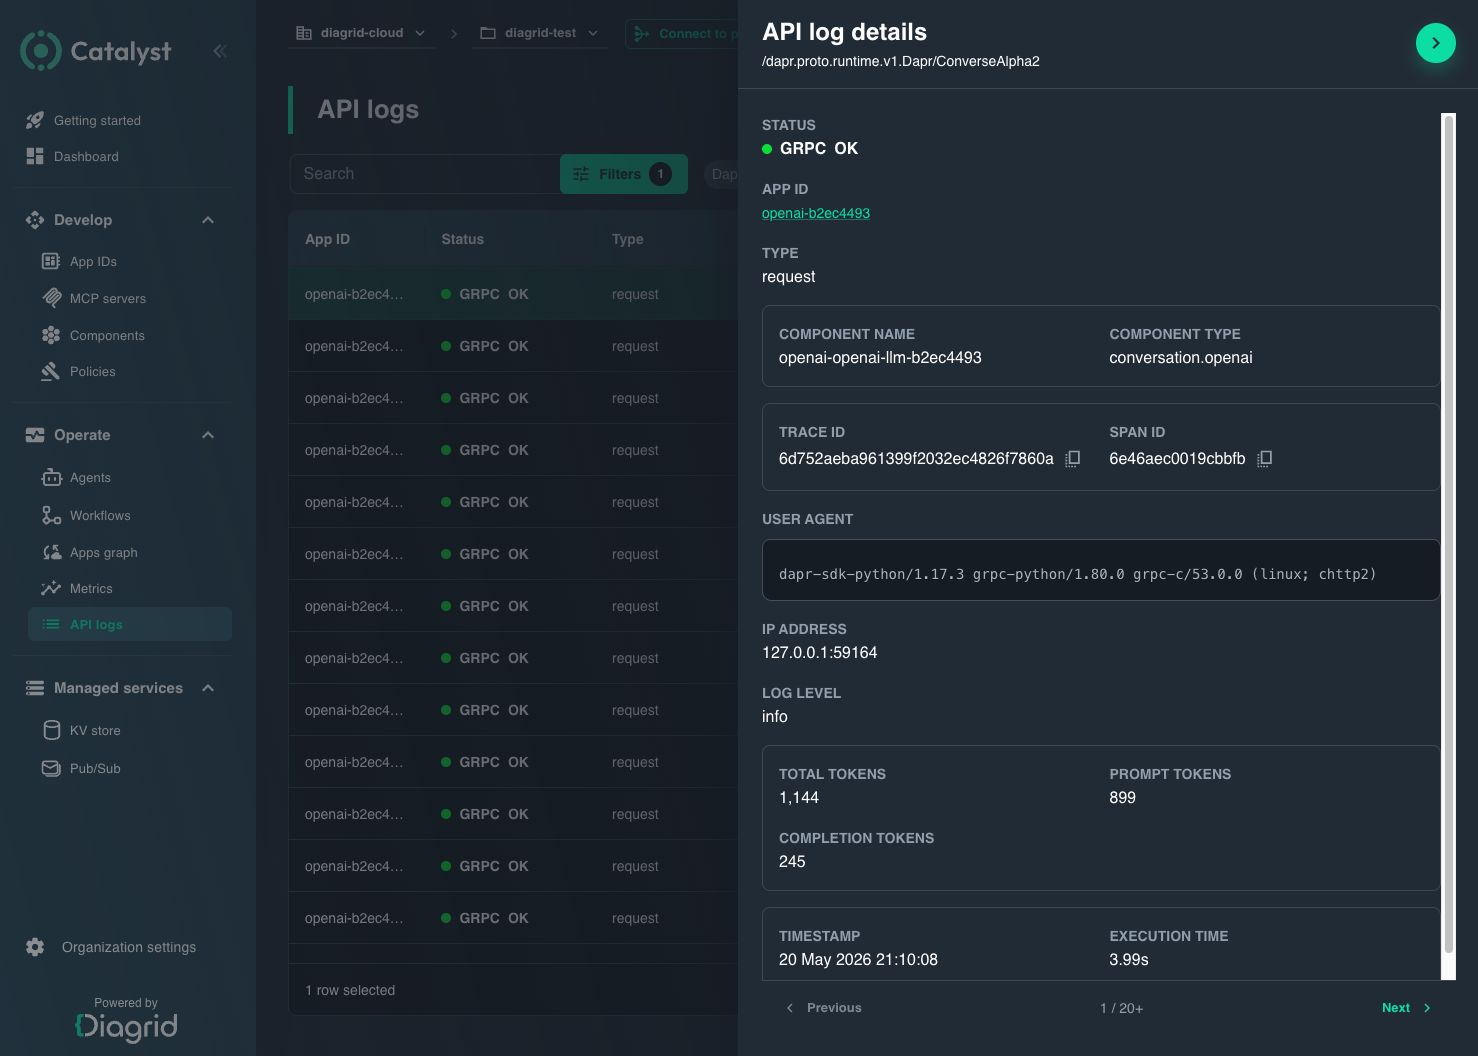
Select a row to open the detail panel. It surfaces the fields above plus the error message (for failed calls), the component name and type that handled the call, the source and target App IDs (for service invocation), the trace ID and span ID so you can hand the request off to your tracing backend (see Observability), the user agent, the caller IP, and the log level. Use the arrow keys to walk through entries without closing the panel.
Filtering
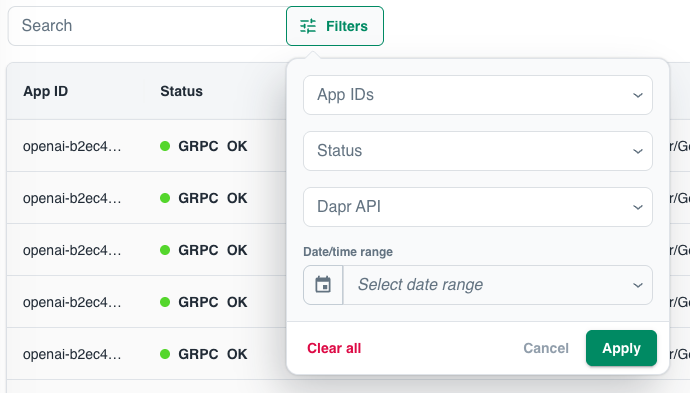
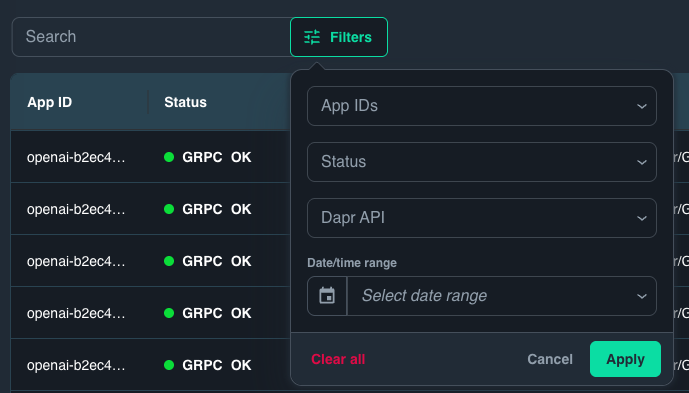
Five filters narrow the table:
- App IDs — multi-select across the App IDs in the current project.
- Status —
successorfailure. HTTP 1xx–3xx and gRPCOKcount as success; everything else is a failure. - Dapr API — one of
bindings,service-invocation,publish,state,workflows, orconversation. - Date/time range — relative shortcuts (last 1 minute, 30 minutes, 12 hours, 3 days) or a custom range. The default is the last 30 minutes.
- Search — free-text search across the error message, request message, method, status, App ID, trace ID, and span ID.
The date/time range filter only looks back 3 days, even though API Logs are retained for 90 days. To inspect older entries, leave the date/time range filter unset and narrow by App IDs, Dapr API, or trace ID instead.
LLM calls
For AI agents and any workload that uses the Conversation API, API Logs captures LLM calls (API = conversation) with extra token fields in the detail panel:
- Total tokens — total tokens billed for the call.
- Prompt tokens — input tokens sent to the model.
- Completion tokens — output tokens returned by the model.
- Completion reasoning tokens — reasoning tokens consumed by reasoning models (a subset of completion tokens, billed separately by most providers). Only shown when the provider returns a reasoning-token count.
The Component name and Component type fields (for example conversation.openai) identify the conversation provider that handled the call, and Execution time captures the end-to-end latency for the call — both shown for every entry.
Two common workflows lean on these fields:
- Cost attribution. Filter
API = conversationand one or more App IDs across a billing window, then sum Total tokens per App ID. Break out Completion reasoning tokens separately when reasoning tokens are priced differently from completion tokens. - Slow or truncated responses. Sort by Execution time to surface the slowest model calls. A high Completion reasoning tokens count usually explains otherwise-surprising latency on reasoning-model providers. A small response paired with a large Completion tokens count typically signals an early stop or truncation, not the model going quiet.
To tie an LLM call back to the agent execution that triggered it, cross-reference with Agents — the agent's Model configuration panel jumps straight to API Logs filtered to that agent's calls.
Inspecting requests from the CLI
API Logs are available from the UI console and the diagrid CLI. The diagrid project logs command returns a single page of project-wide logs as JSON or YAML — unlike diagrid appid logs, which streams API logs from a single App ID.
# Most recent logs for the current project
diagrid project logs

# Filter to specific App IDs and Dapr API logs only
diagrid project logs --appids my-app,another-app --type dapr --limit 50

# Follow the cursor returned by a previous response
diagrid project logs --page <next-page-token>

# Pipe to jq for scripted triage
diagrid project logs --type dapr --limit 200 --output json | jq '.data.result[] | select(.status != "200")'
The --type flag here selects the log channel (app or dapr) and is distinct from the Dapr API filter in the console, which narrows Dapr API logs by building block. See the full reference for every flag.
When to use API Logs vs. other observability surfaces
| Surface | What it answers | Reach for it when |
|---|---|---|
| API Logs (this page) | What did this App ID actually send or receive on the Dapr API, and how did each call resolve? | You need per-request detail — exact method, status, latency, trace ID, or LLM token counts — for a specific call. |
| Metrics | What's the request rate, error rate, and latency distribution over time? | You're looking for a trend or a spike, not a specific request. Start here during a fresh incident, then drill into API Logs. |
| App Graphs | Which services and components is this App ID calling, and where are the hot edges? | You don't yet know which App ID is at fault, or you need topology context for an error. |
| Tracing | How did a single request flow across App IDs and components, span by span? | You have a trace ID from API Logs and need to follow the full distributed path through downstream services. |
For observability configuration — tracing backends, sampling rates, exporting traces — see Observability.
Next steps
Metrics
Spot rate, error, and latency trends before drilling into specific requests.
App Graphs
See the topology of calls between App IDs and components.
AI Agents
Correlate LLM calls in API Logs with the agent execution that triggered them.
Observability
Configure log backends, sampling rates, and trace exporters.